.png?width=2000&name=SDG%20-%20Logo%20White%20(1).png)

In this article, we explore a real-world case of how we helped a multinational company tackle the challenge of monitoring business performance across different geographical areas and time zones, all in real time.
We’ll dive into the details of the cloud analytics architecture we specifically built and the tools we used to achieve this goal.
The Scenario
The client needed a reliable cloud analytics platform to collect and organize all business data in a single location.
The high-level objective? To improve the monitoring and analysis of sell-in KPIs related to volume and value.
The expected benefits are:
- A standard data model applicable to all countries, harmonizing data from different source systems
- A single version of the truth to track and compare actual figures, not only against budgets and forecasts but also versus previous periods
- Institutional reporting and dashboarding covering sales volume, value, budget, and team performance using different filters such as product, customer, sales team, and calendar date
- The decommissioning of the local BI solutions and tools currently in place
- Real-time data that is always available across time zones
- Allowing the smooth creation of local custom analytics and AI initiatives
The Main Challenges
Designing the Architecture
Finding a reliable, high-performance, and easy-to-manage solution that met all the required guidelines.
Managing the Rollout Phase
Simplifying and speeding up the onboarding of new countries onto the platform, using clear methodologies and extensive automation.
The Solution: How It Works and the Tools Used
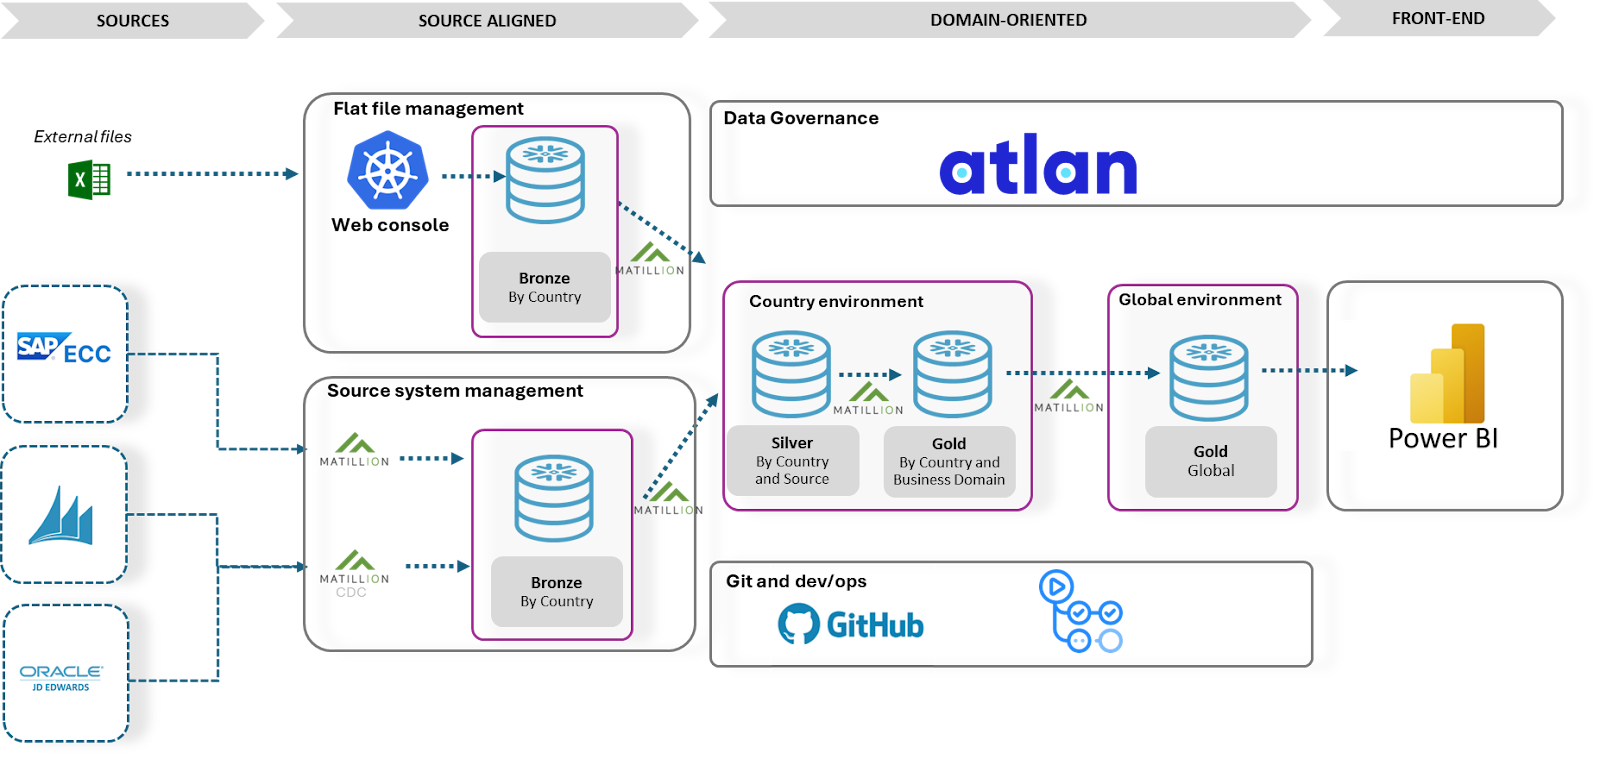
From a data layer perspective, the design consists, for each country, of a Medallion architecture where data coming from the local ERP is transformed and enriched with user data to fill the standard data model.
On top, there is a global gold area where the data of all countries is merged to enable coherent global monitoring and analysis.
From a technical standpoint, the design of the cloud analytics platform is based on customer requirements and expertise acquired in several similar projects. The selected software solutions result from a comprehensive selection process.
The solution is a reliable and high-performing architecture with a mix of tools flexible enough to implement various use cases. Below is a description of the tools and their related usage.
The Tools and Why They Were Chosen
-
The beating heart of the analytics engine. Snowflake was chosen for its processing speed, ease of cost repartition, and its capacity for zero maintenance. Other useful features include its pay-per-use model, short SQL warehouse start time, and zero-copy cloning. The latter is useful for performing automatic quality checks on business transformation logic during releases in quality and production.
-
The SaaS tool for data extraction, loading, transformation, and orchestration. The main capabilities evaluated for its choice are the change data capture feature, full pushdown to the analytics engine of the transformation logic, total compatibility with the target engine (in this scenario Snowflake), and native integration with the Git repository.
Other useful features include a single, easy-to-use interface, data lineage, and complex orchestration management.
The ingestion from the different ERP source systems is done using Matillion capabilities. For Navision and JD Edwards, the ingestion is handled by the Matillion CDC agent, ensuring a near real-time copy of source tables is always available in the bronze layer, consequently reducing the overall duration of the ELT process.
For the SAP ECC system, the extraction is done using the native Matillion SAP NetWeaver connector.
In this scenario, the extraction of data is the first step of the orchestration job.
To ingest user data, typically from Excel files, we have created a web solution that validates the data before importing it into the bronze layer. The process begins with defining templates, categories, and user permissions. Users can then access these templates to upload their files, which trigger automatic checks for file structure, column data types and formats, primary keys, foreign keys, and null values. If the file passes all checks, the data is loaded into the bronze layer; otherwise, users receive a list of failed checks to correct and re-upload the file.
-
The tool for data governance. The decision is mainly related to its innovative approach that combines data governance and DataOps culture. The key concepts of DataOps are collaboration, agility, trust, and user experience. With DataOps, business users, analysts, and data engineers can easily collaborate to increase the efficiency and agility of initiatives related to data.
-
Used for defining reporting models. This decision is primarily based on its capabilities, which include a user-friendly interface for dashboard creation, a comprehensive set of data visualization objects, an intuitive end-user self-service interface, and the availability of a dedicated mobile app.
-
The platform for source code storage and versioning. The code is organized into branches; the main ones are quality and master. The master is also tagged using the semantic method. There is a feature branch for every development. Pull requests are used to promote a specific development branch to quality and production; attached to the pull request is an automatic action to validate the result.
Also, using GitHub actions, we automated most of the repetitive platform tasks:Onboarding New Countries: This action executes the provisioning of Azure services, the creation of databases, schemas, tables, and roles in Snowflake, and the addition of the standard object set in Matillion based on ERP type.
Validating Matillion Transformations: An action for checking the new or changed Matillion transformations before promoting them to quality and production environments. The checks verify the naming convention and whether the new and changed objects work as expected.
Promoting Developments in Quality and Production: This action retrieves the list of changed and new objects, then applies the changes to the target environment by executing all necessary steps to align it.
Implementation and Rollout
The project followed the "Vanilla Approach", which refers to implementing a solution in its standard form ensuring that it works universally, before adding any specific adjustments or enhancements due to the onboarding of new entities, in this context the new countries.
New requests will be treated as enhancements and will be listed during the last phase to add them after the first release. The solution is composed of three stages. This modular approach allows countries to reach different stages of implementation according to resource availability at each moment.
The three phases are:
-
Technical Setup: Specific country source systems are added to the platform and, based on source system type, the standard business transformation logics are configured. This step is done by executing the GitHub action for new country onboarding
-
Technical Rollout: Country peculiarities are added to the standard model to reconcile data with the existing BI. The country data is included in the global gold layer
-
Sell-In Rollout: Custom local analysis not present in the standard model is added, and data is validated with business users. The last step is releasing the new country ecosystem to the production environment using the specific GitHub action
The chosen implementation approach follows the Waterfall methodology, given the clearly delineated stages outlined above.
Conclusion
In summary, this article demonstrates the challenges and solutions from a real use-case where a multinational company needed to monitor cross-country sales performance.
The solution that SDG Group developed oversaw the implementation of a cloud analytics solution that is reliable and high-functioning thanks to the native functionalities of the tools leveraged.
When designing a cloud analytics architecture, including guidelines and best practices, it is critical to have well-defined business goals, a detailed roadmap, and a clear list of technical features for software selection. There is no one-size-fits-all: only the solution that takes your business and use-case into account.
Want to discover what will work best for you? Let's talk!