Filters are arguably among the most well-known and valuable operations that can be applied to data. Filters, along with optimization techniques like predicate pushdown — which internally filters data — can significantly enhance our queries by swiftly discarding data that is no longer required in our applications.
Filters are generally not considered costly operations, and Spark typically handles them efficiently… until it doesn’t.
But … what happens when things go awry? what happens when something doesn’t work as expected in Spark?
This article marks the beginning of a series in which we’ll delve into and attempt to figure out some of the enigmatic cases I’ve come across where Spark didn’t perform as expected — or at least, not as I expected to work.
The Case
Recently, during the migration of a workflow from a Spark project, my team and I encountered a significant delay when Spark alledegly does its magic, that is, preparing and optimizing the execution plan of a dataframe.
This workflow was quite standard, involving basic transformations such as reading from Hive tables, dropping/renaming/selecting fields, applying filters, and performing joins — nothing out of the ordinary. Despite its simplicity, it took Spark several minutes only to start with the execution plan.
Upon debugging, we pinpointed the issue to a dataframe filter. The filter itself was straightforward: we had a table containing approximately 40 decimal fields, and we aimed to filter out all rows with a non-zero value in at least one of these fields. The problem didn’t manifest during the filtering transformation but rather emerged later when attempting to join this dataframe with another.
Without this filter, the workflow proceeded smoothly, and Spark efficiently completed the tasks. However, with this specific filter, it took Spark several minutes just to initiate processing data. Interestingly enough, there were no errors, no warnings, no nothing, just a plain and simple — but very noticeable — delay.
We were deploying the application on a Cloudera 7.1.7 cluster with Spark 2.4.7, but luckily, reproducing the issue was straightforward in our local environment…
DIY (= Do It Yourself)
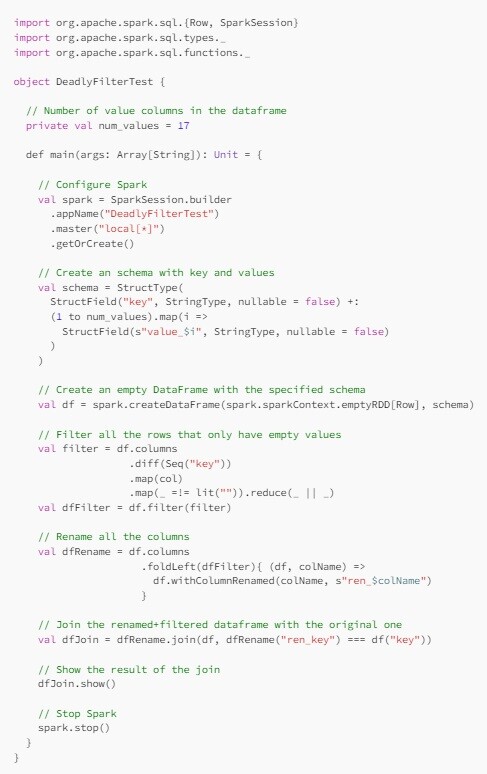
Before we delve deeper into analyzing this case, I highly recommend reproducing it in your own environment to gain a better understanding of the situation. To do so, let’s follow these steps:
- Create a dataframe with 18 string columns: key, value1, value2, …, value17.
- Filter all the rows in the dataframe that contain empty values in the value columns.
- Rename all the columns of the filtered dataframe.
- Join the renamed dataframe with the original one based on their key fields.
- Show the joined dataframe
In Scala, the code for this would look something like the following…

Despite its apparent simplicity, this seemingly trivial code unexpectedly causes Spark to take minutes to complete.
After playing around with this code, there are some takeaways:
- The issue is not data-related: Strikingly, the problem is reproducible even with empty dataframes. Therefore, it seems totally unrelated to the data been used.
- Column type is not a factor: Although our real workflow used decimal columns, the test example indicates that the same issue occurs with string columns. This suggests that the problem is not specific to a particular data type.
- The number of value columns indeed plays a role: The delay is not consistent. It becomes noticeable when there are 13 or more value columns, and the delays grow exponentially with an increasing number of columns. With just 17 value columns, it takes Spark several minutes to complete.
-
All three transformations are necessary: The delay only manifests when all three transformations (filter, renames, and join) are applied. Showing the filtered and renamed dataframes individually or displaying the join dataframe without applying filter or rename transformations does not cause any delay.
Solution #1: Workaround
In our initial attempt to address the issue, we tried a similar approach but with a twist. Instead of applying the filter before the join, we introduced a new boolean field with the filter expression and later filtered out the rows based on this field. This was done after performing additional transformations and joins with other dataframes, because when we attempted to filter the rows immediately after the join, the problem persisted.
With the Catalyst optimizer being the suspected culprit, our strategy was to attempt to deceive the optimizer by preventing any optimization on the filter operation. While this solution proved effective, it came at the cost of handling more data than necessary. This was because all rows, whether meeting the filter criteria or not, remained in the dataframe after subsequent transformations. Dealing with millions of rows in this manner proved to be quite resource-intensive and time-consuming.
Solution #2: Caching
Upon reflection, we discovered that everything worked seamlessly by simply caching the filter dataframe. The underlying concept remained consistent with the previous solution — outsmarting the optimizer. However, in this case, minimal adjustments were needed in our code, and rows were filtered before the join. Was it a win-win solution? However, caching a dataframe solely for the purpose of deceiving the optimizer didn’t feel like a solution we could take pride in… did it?
Solution #3: Constant Propagation
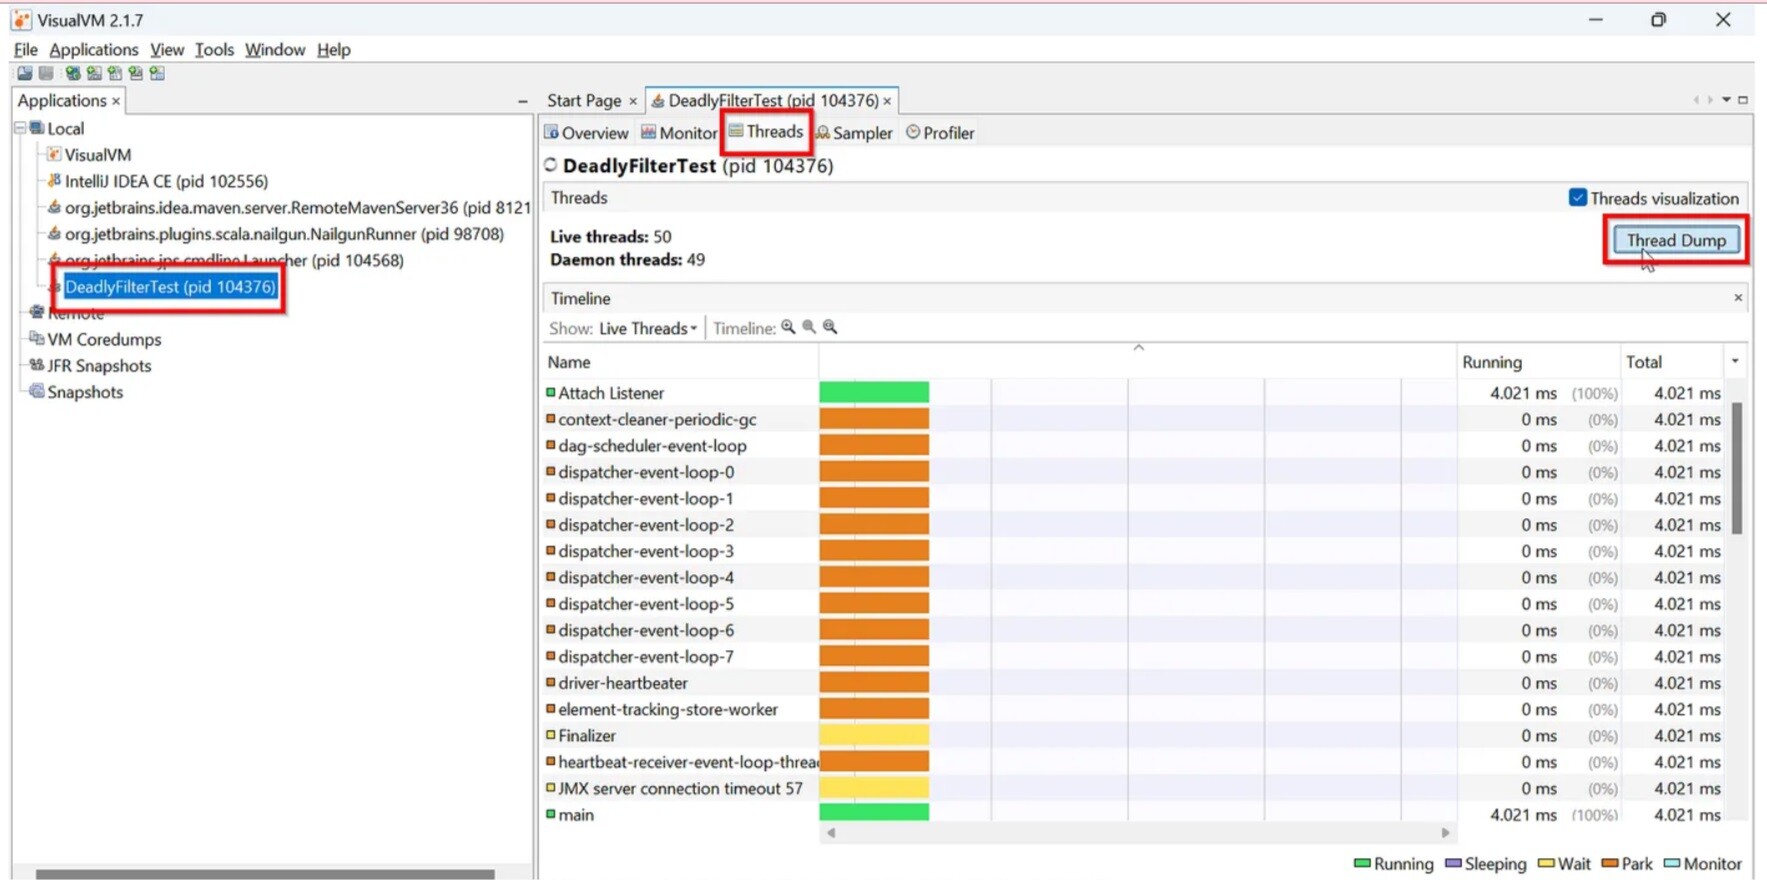
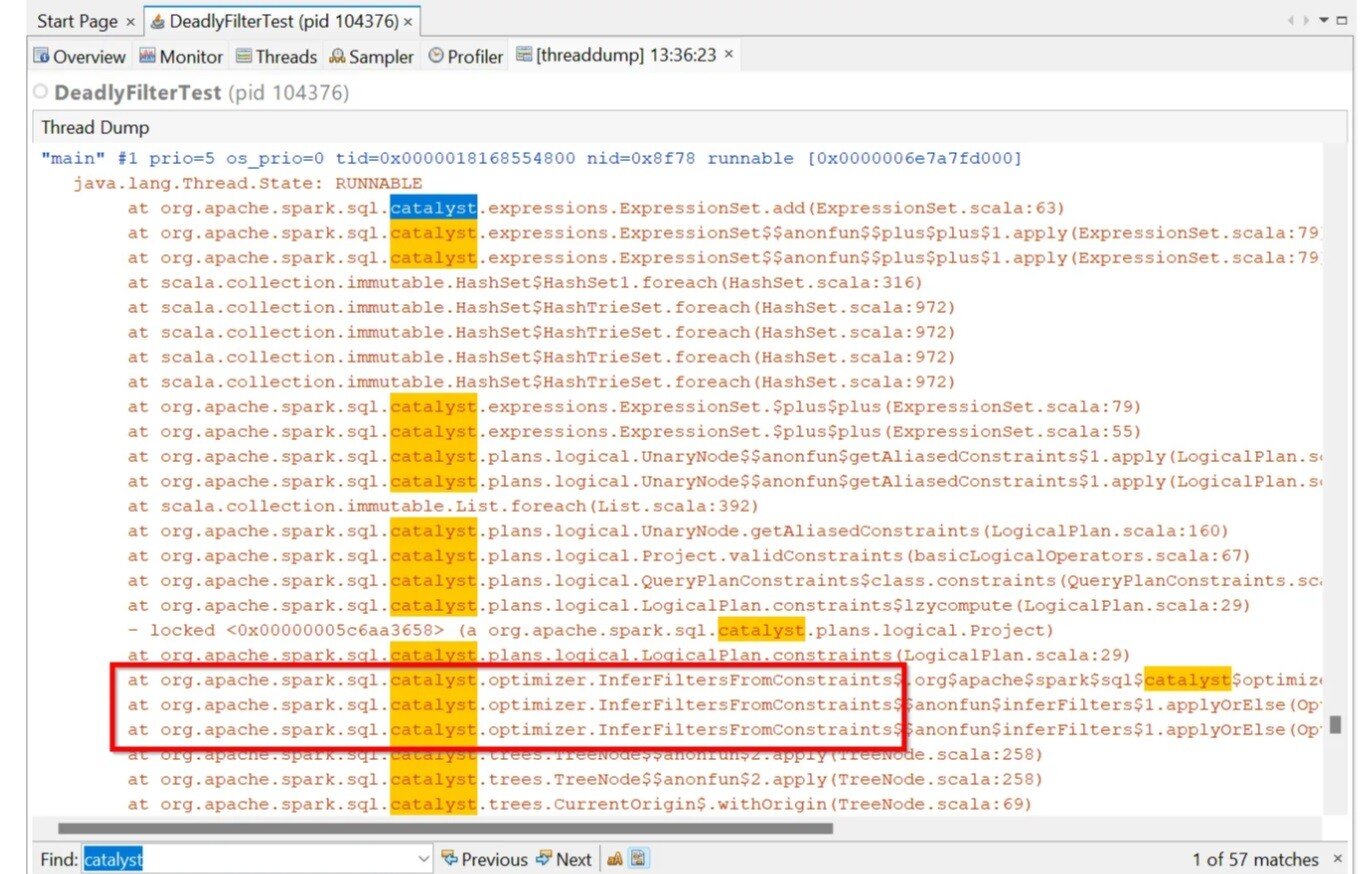
Having arrived at a decent-but-not-perfect solution, and driven by curiosity, we decided to investigate the root cause of the issue. Since we could reproduce the problem in an isolated test environment, it was relatively easy to catch Spark “red-handed” during the delay. To achieve this, we obtained a thread dump of the test program using the Visual VM tool.

1] Select the process. 2] Click the “Threads” tab. 3] Click the “Thread Dump” button

1]] Ctrl + F = to open the “Find” textbox at the bottom 2] “catalyst” + Enter = to do the search
Within the stacktrace of our main thread, certain lines stood out: org.apache.spark.sql.catalyst.optimizer.InferFiltersFromConstraints.
This optimizer rule was our pain in the neck, so we only had to exclude it from the Catalyst Optimizer set of rules:

There isn’t much information available on the internal workings of this rule. However, through some Internet searches, we uncovered two key insights:
- This rule adds additional filters from an operator’s existing constraint (https://dataninjago.com/tag/spark-catalyst/).
- It appears to be a known issue that can be disabled using spark.sql.constraintPropagation.enabled=false (https://issues.apache.org/jira/browse/SPARK-33013).
Certainly, the constraintPropagation configuration not only resolved our problem but, we suppose, is a preferable alternative to outright excluding the rule.
NOTE: All things considered, this third solution could be deemed the best … but only because disabling constraint propagation had no adverse effects on other parts of our workflow. Had it negatively impacted other transformations, we might have chosen the caching solution, even though caching was totally unnecessary in this case.
Spark 2.4 vs Spark 3.4
The code provided in the DIY section was tested with both Spark 2.4 and Spark 3.4. While the delay was reproduced in both versions, it’s worth noting that Spark did not behave exactly the same in each case.
In Spark 2.4, the execution resulted in the creation of thousands of objects of type org.apache.spark.sql.catalyst.expressions.Or . This led to unexpected memory consumption, with the number of objects created and memory usage increasing proportionally to the number of value fields in the filter.

The only problem is … the “almost barely noticeable” fact that while the execution time is less than a minute in Spark 2.4, in Spark 3.4 takes it almost 23 minutes to complete the execution of exactly the same lines of code.
Conclusion
In broad terms, Spark is a fantastic tool for handling data. The learning curve isn’t steep — especially if you are already familiar with SQL basics, it’s usually fast in processing data and even comes with different flavours: SQL, Java, Scala, Python and R. Spark shines when everything goes smoothly, but it can quickly transform your best dreams into a mind-boggling and nerve-wracking nightmare when issues arise and you’re up against a tight deadline.
To put it bluntly, Spark can be sometimes a treacherous black-box, and a very complex one. Unraveling the nuts and bolts of Spark is not — at all — an easy task. Having worked with Spark for the past 8 years, I still find myself surprised at times. Times when some weird issue or performance problem arises and I catch myself thinking … WTF??? (=Why That Fails???).
I hope you have enjoyed reading this article — at least — as much as I enjoyed writing it. Looking forward to having you back for the next installment!
Sick and tired of debugging some error or performance issue? I might help you! Send me your case! I’m genuinely passionate about intriguing errors and performance challenges — those are the things that keep me up at night and also thinking while walking my dog. I’ve been solving interesting cases for the last 15 years. so … don’t hesitate to reach out to me at https://www.linkedin.com/in/angel-alvarez-pascua .
Author:
Ángel Álvarez Pascua
SDG Group Specialist Lead
.png?width=2000&name=SDG%20-%20Logo%20White%20(1).png)


